The Big PictureOver the past 30 days, 58 homes sold across Fort Erie’s eleven neighbourhoods, up from 55 in the prior 30 days and well ahead of the 40 sold in the same stretch last year. The

Dated: August 28 2026
Views: 28
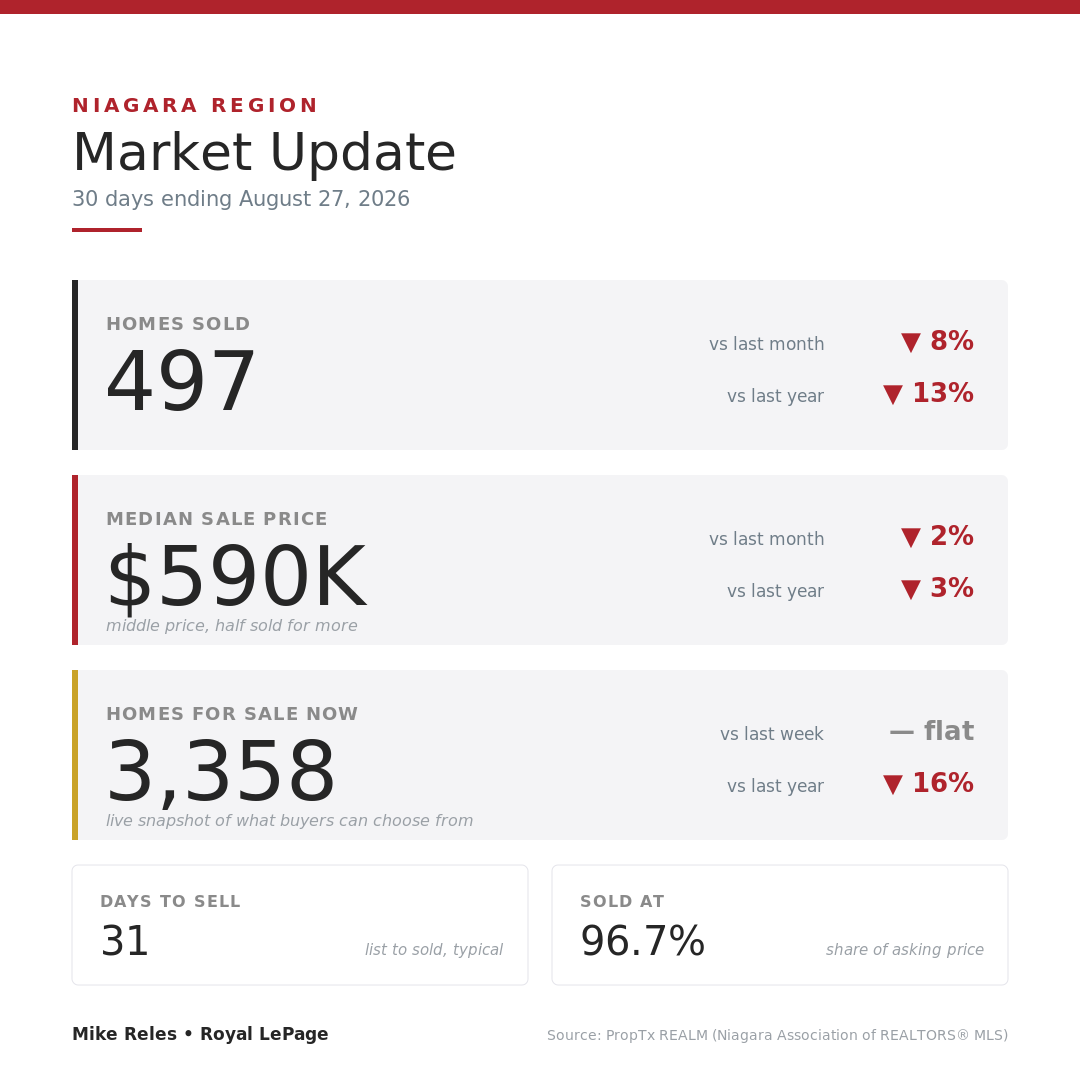
The short version this month: sales cooled again, the typical price eased to $590,000, and there are still plenty of homes for sale. Over the 30 days ending August 27, 497 homes sold across the Niagara Region, down about 8% from the month before and about 13% from the same stretch last year. The typical home sold for about $590,000, a little below the $600,000 of a month ago and the $610,000 of a year ago. Put those together and buyers keep the upper hand on choice and negotiating room, while homes priced sensibly still sell in about a month. Here is the detail, for the region as a whole and then for Fort Erie, Port Colborne, and Niagara Falls.
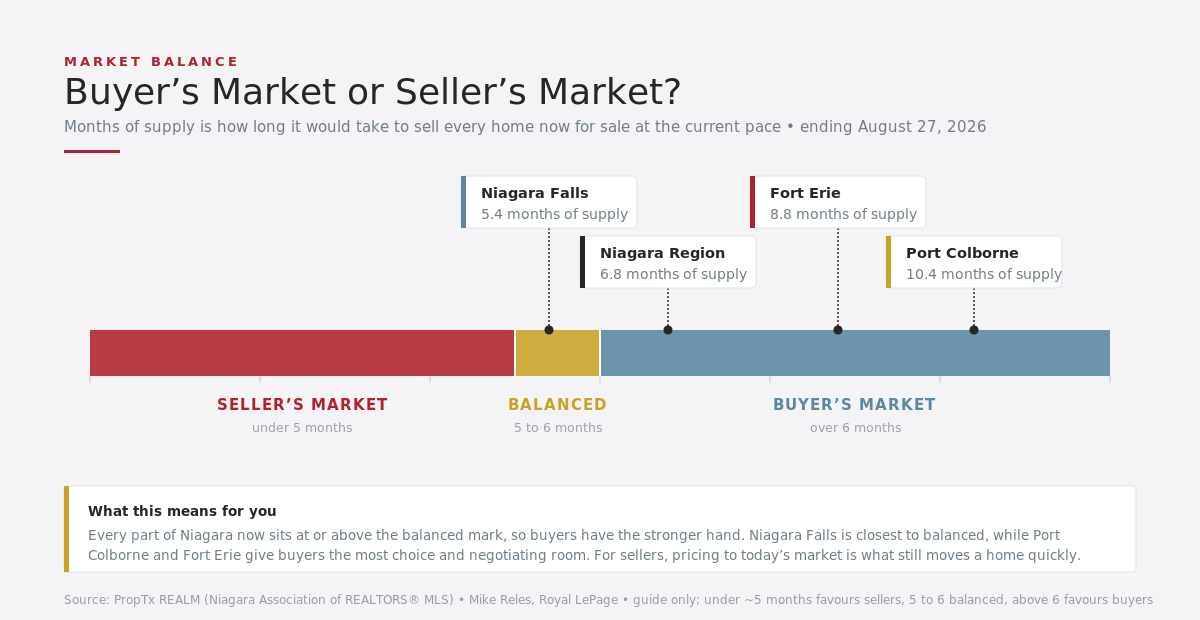
Across the whole region, 497 homes sold over the 30 days ending August 27. That is down from 542 the month before and 571 in the same period a year ago, so a little more than one in ten fewer sales than last summer. The median sale price was about $590,000. That has eased gently: it was about $600,000 a month ago and $610,000 a year ago, so prices are off roughly 2% over the month and 3% over the year, a slow drift rather than a drop. The figure worth watching is how many homes are for sale. There are 3,358 on the market right now, almost exactly the 3,366 of a week ago, so inventory has held steady week to week. Compared with a year ago it is down about 16%, from 3,991 for sale last August, so there is less choice than last summer even though the overall number stays high. At the current pace of sales that is about 6.8 months of supply, which is a plain way of saying that if no new homes were listed it would take roughly seven months to sell everything already for sale. As a rough guide, under about five months tends to favour sellers, five to six is balanced, and above six starts to favour buyers, so the region sits in buyer-friendly territory. One thing has not softened: homes that are priced right still sell fast. The typical home took 31 days to sell and sellers received about 96.7% of their asking price, so close to 97 cents on every dollar they asked. The gap keeps widening between homes priced to today's market, which sell quickly and near asking, and homes priced too high, which sit and add to that large pool of listings.
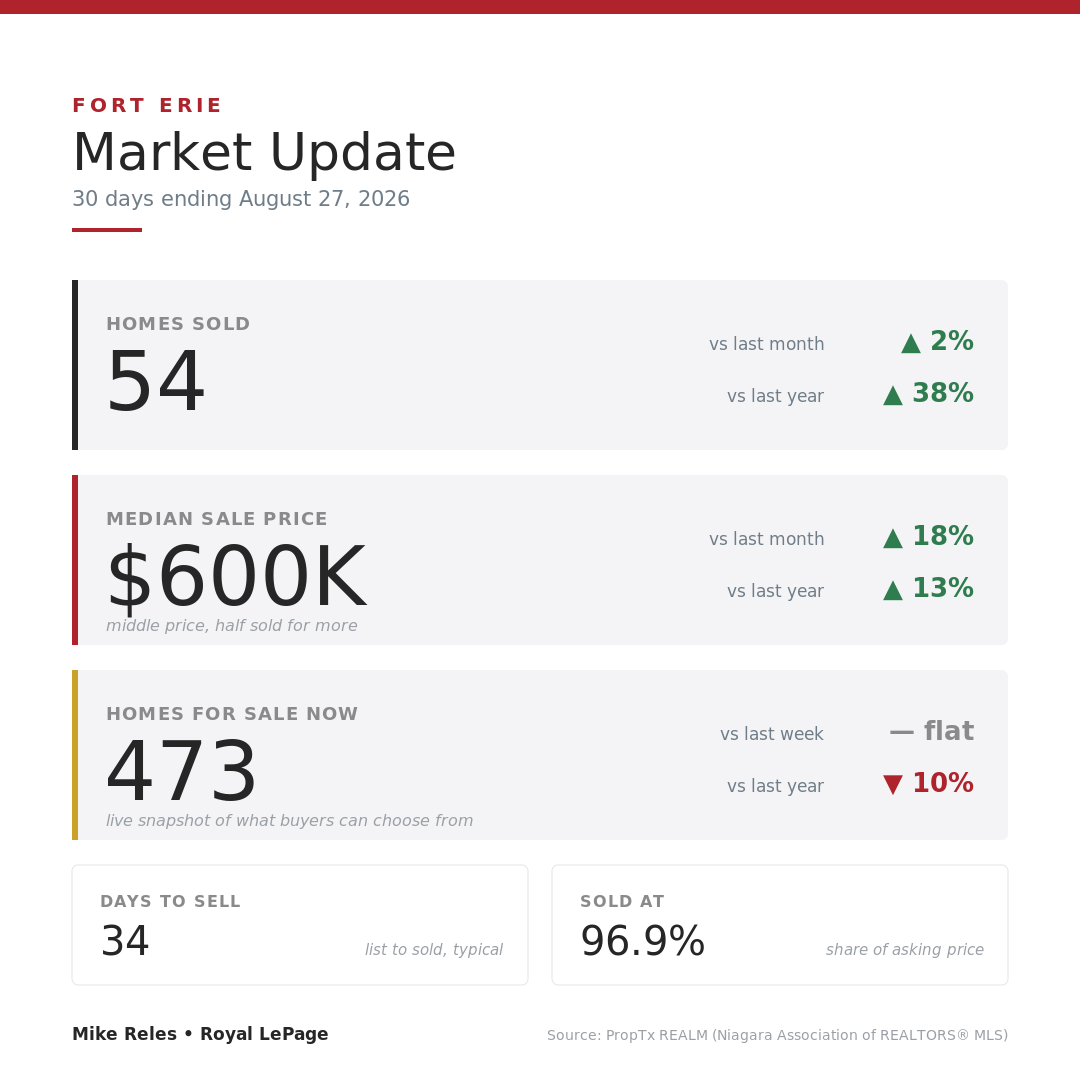
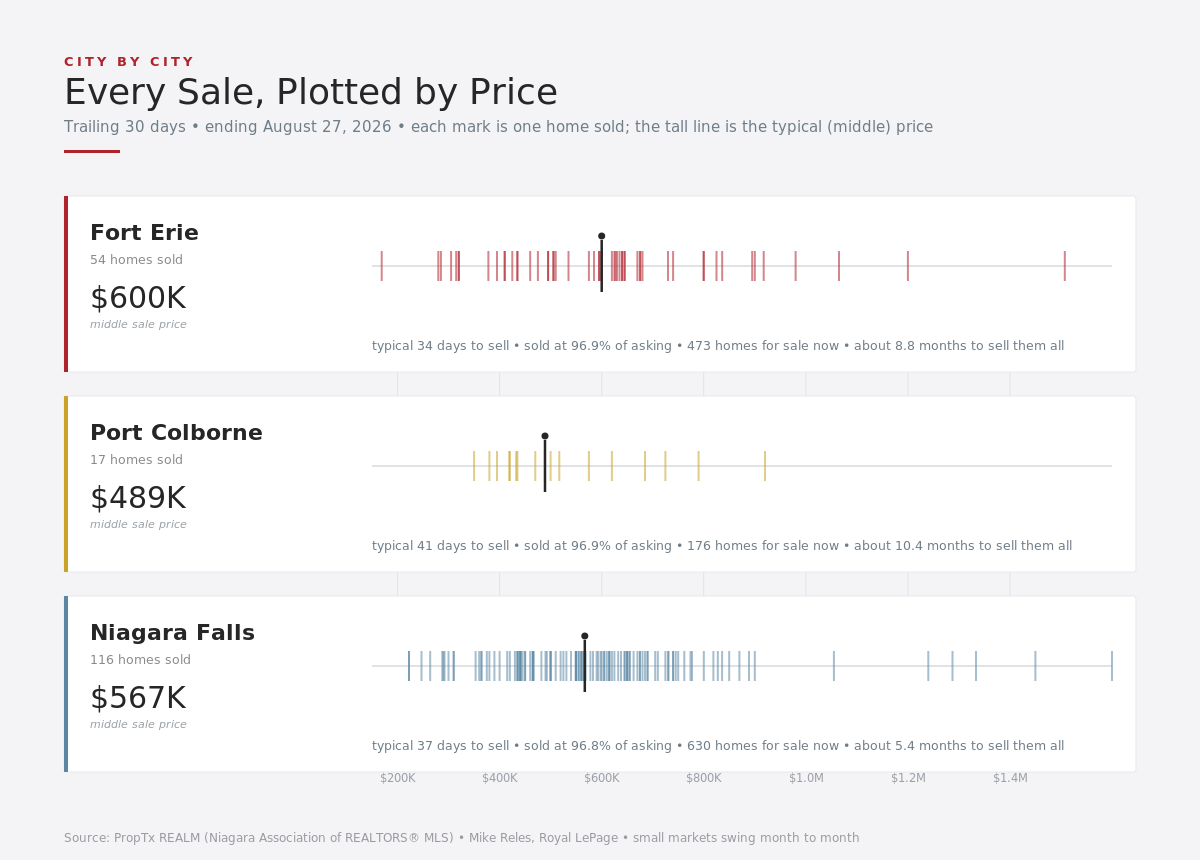
Fort Erie saw 54 homes sell over the 30 days ending August 27, up slightly from 53 a month ago and up sharply from 39 a year ago, so sales here have held firm month to month and climbed well above last summer. The typical home sold for about $600,000. That is up from $510,000 a month ago and $530,000 a year ago, but a swing that large says more about which homes happened to sell than about a real leap in values. Fort Erie is a smaller market, so its middle price can move simply because the mix of homes that sell changes from month to month. Homes took a median of 34 days to sell and sold at about 96.9% of asking. What stands out is choice: there are 473 homes for sale, about the same as a week ago and down about 10% from 525 a year ago, which works out to about 8.8 months of supply at the current pace. That is a buyer-friendly market. If you are buying, you have plenty of options and real room to negotiate. If you are selling, you are competing against a deep pool of other listings, so sharp pricing and good presentation matter more than ever. Browse current Fort Erie homes for sale to see what is on the market today.
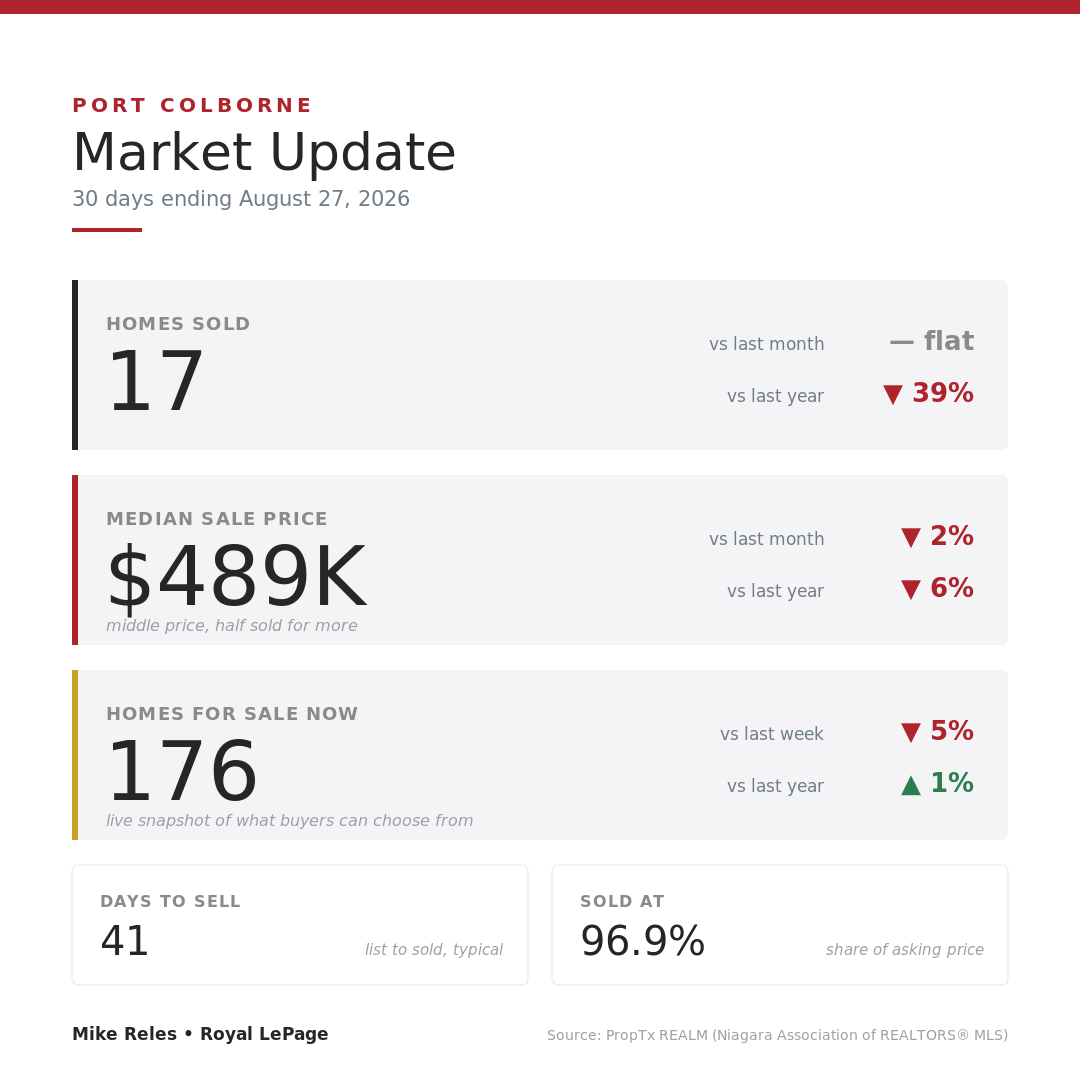
Port Colborne recorded 17 sales over the 30 days ending August 27, the same as the month before and below the 28 that sold a year ago. This is a small market, so its monthly counts bounce around and any single month should be read loosely. The typical sale price was about $489,000, down about 2% from $500,000 a month ago and about 6% from $520,000 a year ago, though that figure can move simply because so few homes sell in any given month. Homes took a median of 41 days to sell and sold at about 96.9% of asking. With 176 homes for sale, about 5% fewer than a week ago and essentially level with the 175 for sale a year ago, Port Colborne has roughly 10.4 months of supply. That is the most buyer-friendly of the four areas. For buyers, it means wide choice and a strong hand at the negotiating table. For sellers, it means standing out on price and condition is essential. See current Port Colborne homes for sale for the latest listings.
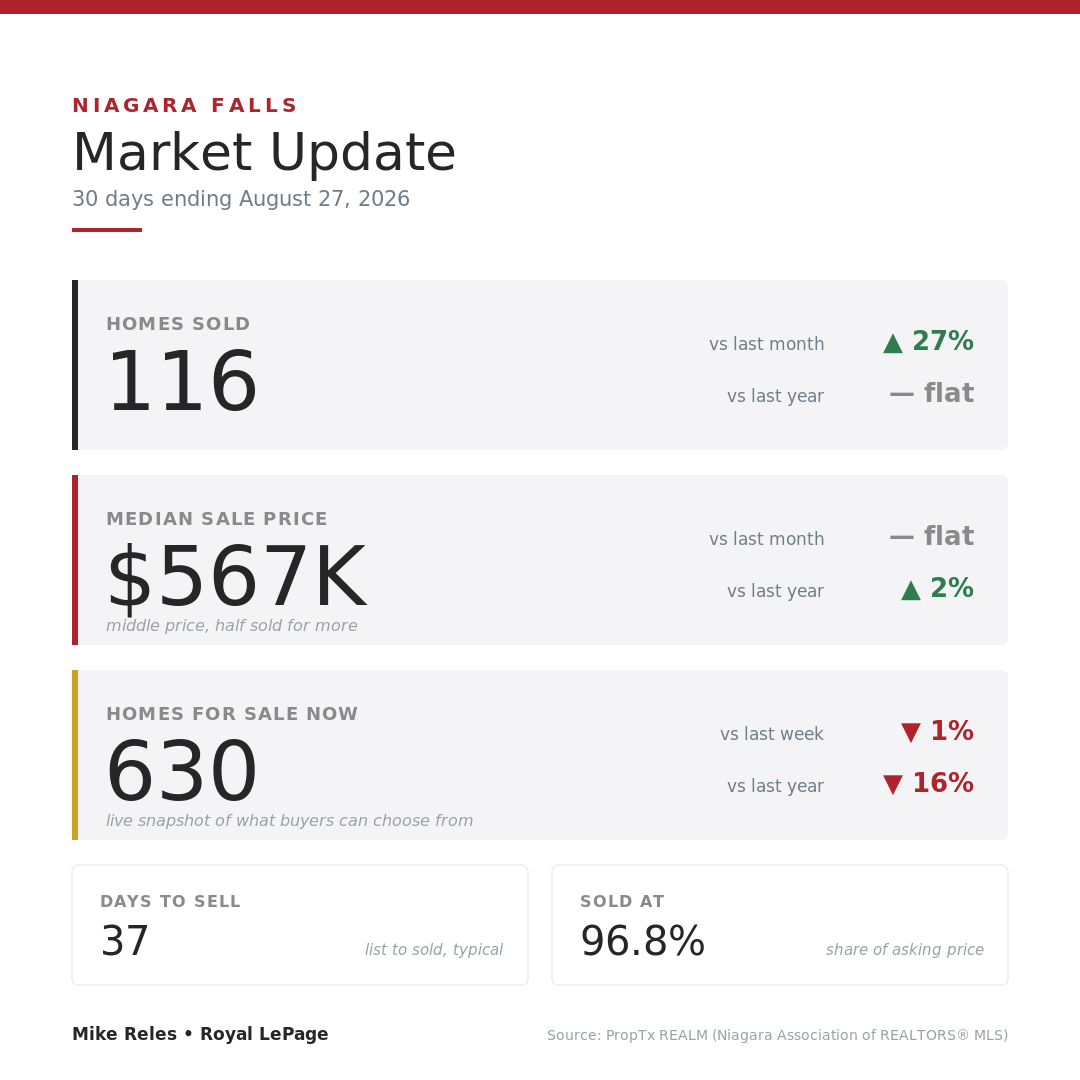
Niagara Falls recorded 116 sales over the 30 days ending August 27, up from 91 a month ago and about even with the 116 that sold a year ago. The typical home sold for about $567,000, essentially flat against $565,000 a month ago and up about 2% from $557,000 a year ago, so prices here have stayed close to steady over the year. On the measures that show how competitive a market is, Niagara Falls is the tightest of the three cities: homes sold in a median of 37 days and at about 96.8% of asking, and its 630 homes for sale, about the same as a week ago and down about 16% from 750 a year ago, work out to roughly 5.4 months of supply, lower than Fort Erie or Port Colborne. In plain terms, buyers here still have choice, but homes tend to sell a little faster relative to the size of the listing pool than in the other two markets. Explore current Niagara Falls homes for sale to compare what is available now.
Over the 30 days ending August 27, 2026, the median sale price across the Niagara Region was about $590,000.
At about 6.8 months of supply region-wide, Niagara sits in buyer-friendly territory. Port Colborne and Fort Erie, at roughly 10.4 and 8.8 months of supply, tilt further toward buyers, while Niagara Falls is tighter at about 5.4 months.
Over the 30 days ending August 27, 2026, the typical sale price was about $600,000 in Fort Erie, $489,000 in Port Colborne, and $567,000 in Niagara Falls.
The typical home across the region sold in about 31 days and sold at roughly 96.7% of its asking price. Homes priced to the current market continue to sell quickly.
Step back from any single week and the picture across Niagara is steady: sales have cooled, the typical price has eased to $590,000, and a large number of homes for sale continues to give buyers more choice and negotiating room than they have had in years. The region as a whole sits at a buyer-friendly 6.8 months of supply. Niagara Falls is tighter at about 5.4 months, while Fort Erie and Port Colborne run higher, around 8.8 and 10.4 months, which puts them further into buyer-friendly territory. If you are selling, this is not a reason to worry, but it is a reason to be realistic. Homes priced to today's market are still selling quickly and close to asking, while overpriced ones are the ones sitting and adding to inventory. If you are buying, the balance has shifted your way, though the quick sale times show that the best-priced homes still do not last long. Whether all of this is good news depends on which side of the deal you are on, and on your specific neighbourhood and price range, which can move differently from these regional averages. Curious what your own home would sell for in today's market? Get a free home valuation to see where you stand.
Want a personalized market analysis for your home? Book a call anytime, I'd love to help.
Mike Reles, Royal LePage | Data source: PropTx REALM (Niagara Association of REALTORS® MLS). Sold figures reflect residential freehold and condo sale transactions over the trailing 30 days ending August 27, 2026, across the Niagara Region and within the municipalities of Fort Erie, Port Colborne, and Niagara Falls, with month-over-month and year-over-year comparisons drawn from the equivalent periods. Active listing counts are a live snapshot from PropTx REALM and include all freehold and condo property types, excluding vacant land. Year-over-year comparisons of homes for sale use historical active-listing counts from Habistat for the same date one year earlier, and the homes-for-sale figure on the social cards shows both the change from the prior Friday's count and the change from a year ago. Months of supply is the number of homes for sale divided by the trailing 30-day pace of sales.

I believe that real estate is personal. Not only is it the most meaningful investment in your life, but your home is also the place where you create memories with the people that you care about most. ....
The Big PictureOver the past 30 days, 58 homes sold across Fort Erie’s eleven neighbourhoods, up from 55 in the prior 30 days and well ahead of the 40 sold in the same stretch last year. The
The short version this month: sales cooled again, the typical price eased to $590,000, and there are still plenty of homes for sale. Over the 30 days ending August 27, 497 homes sold across the
The Big PictureOver the past 30 days, 55 homes sold across Fort Erie. The typical home sold for about $600,000, took about a month to sell (a median of 31 days), and went for roughly 97.3% of.
Sales have eased again, the typical price is holding just below $600,000, and there are still plenty of homes for sale. Over the 30 days ending August 20, 512 homes changed hands across the Niagara