The Big PictureOver the past 30 days, 58 homes sold across Fort Erie’s eleven neighbourhoods, up from 55 in the prior 30 days and well ahead of the 40 sold in the same stretch last year. The

Dated: September 7 2026
Views: 82
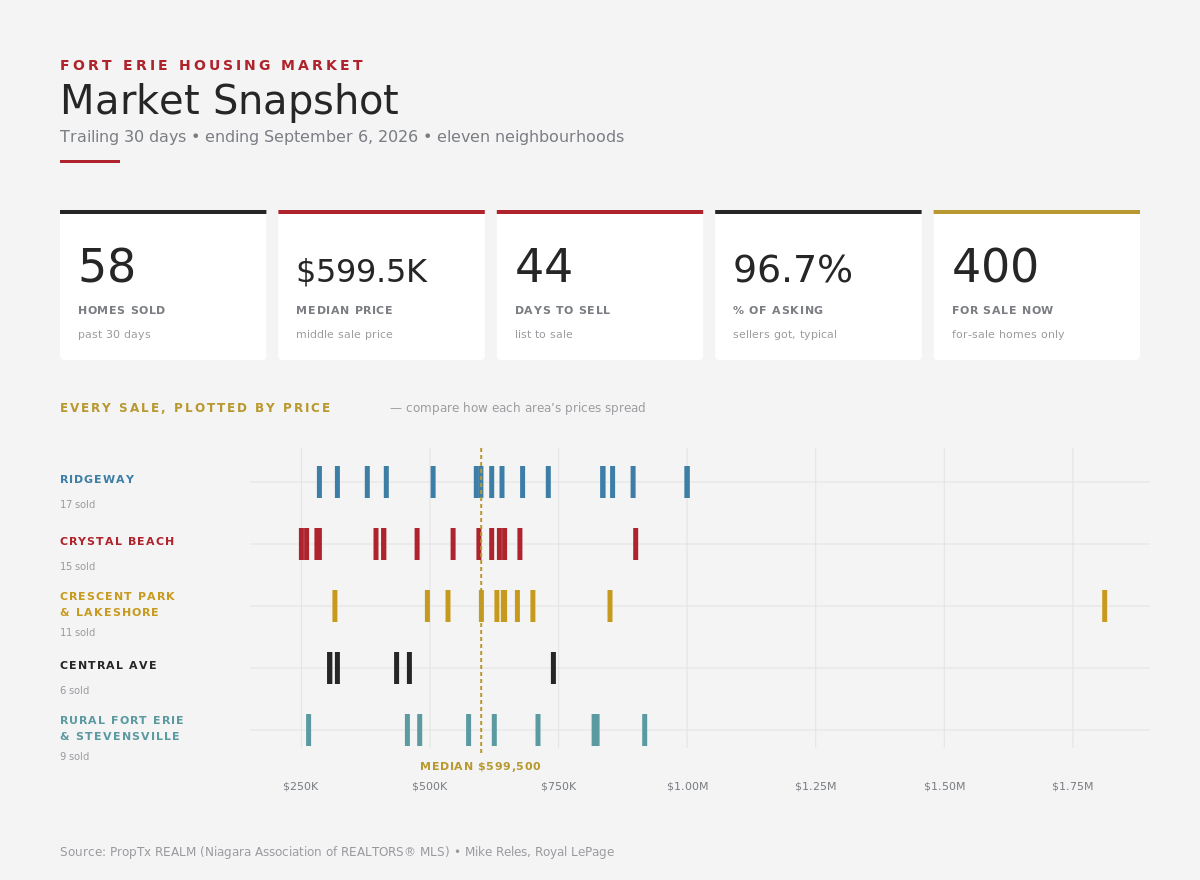
Over the past 30 days, 58 homes sold across Fort Erie’s eleven neighbourhoods, up from 55 in the prior 30 days and well ahead of the 40 sold in the same stretch last year. The typical home sold for about $599,500, took a median of 44 days to sell, and went for roughly 96.7% of asking. Total dollar volume was about $34.7 million, and 7 homes leased at rents from $1,995 to $6,500.
There are 400 homes for sale across Fort Erie right now, and active rentals sit at 41. That is down about 22% from a year ago, when 511 homes were on the market town-wide, with the pullback sharpest in Crystal Beach and the rural pocket, and mildest in Central Ave. The live count is also lower than last week in every area, most sharply in the rural pocket and Central Ave (Bridgeburg), as the late-summer supply build-up starts to thin out.
Year to date, from January 1 to September 6, 390 homes have sold, up about 2% from 381 over the same stretch last year, and the typical price of $550,000 is unchanged from 2025. Both the pace of sales and the price level are tracking last year closely, with this year running just slightly ahead on volume.
Most sales cluster between $400,000 and $850,000, with Crescent Park & Lakeshore spreading widest, from a $315,000 home to a $1.8 million one. The average sale price (about $598,200) sits almost right on top of the median of about $599,500, a tighter grouping than last week, when a few higher-end deals pulled the average up. The strongest fresh sale this week was 641 Burleigh Rd N in Ridgeway, which crossed the million-dollar mark at $1,000,000.
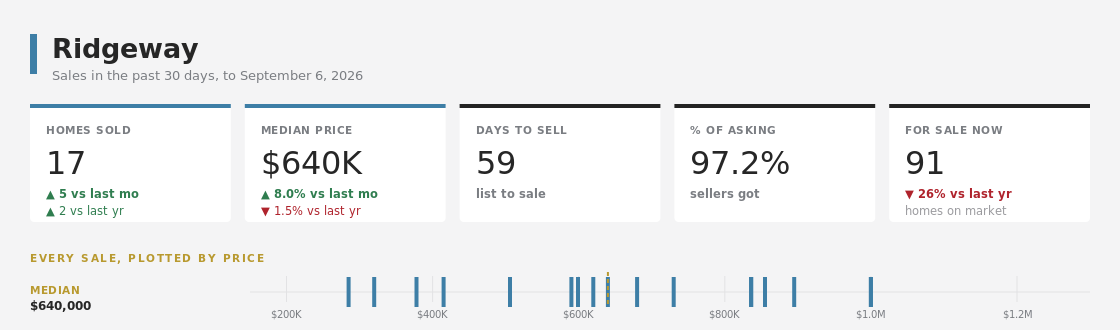
Ridgeway sold 17 homes at a median of $640,000, five more than last month though the median held essentially flat on the year, down about 1.5%. Three sales were new this week, led by 641 Burleigh Rd N, which crossed the million-dollar mark at $1,000,000, and 2793 Dominion Rd at $620,000. The quickest of the fresh sales was 3832 Highland Dr, which sold in just 13 days at $415,000. Homes took a median of 59 days to sell overall. Year to date Ridgeway has sold 104 homes, close to last year’s 108, at a median right around $614,000, essentially flat on 2025. There are 91 homes for sale, down about 26% from a year ago.
Ridgeway home sales, 30 days to September 6, 2026
| Address | Type | Sale Price | SP/LP | DOM | Sold |
|---|---|---|---|---|---|
| 3832 Highland Dr NEW | Detached | $415,000 | 97.6% | 13 | Sep 3 |
| 2793 Dominion Rd NEW | Detached | $620,000 | 99.2% | 118 | Sep 2 |
| 641 Burleigh Rd N NEW | Detached | $1,000,000 | 92.2% | 61 | Aug 31 |
| 26 Sassafras Row | Condo Townhouse | $836,000 | 98.4% | 64 | Aug 28 |
| 3398 Dominion Rd | Detached | $590,000 | 98.3% | 41 | Aug 28 |
| 495 Stonemill Rd | Detached | $285,000 | 95.0% | 3 | Aug 28 |
| 40 Driftwood Tr | Detached | $1,000,000 | 95.2% | 59 | Aug 27 |
| 93 Park St | Detached | $855,000 | 95.0% | 66 | Aug 27 |
| 3767 Summit Ave | Detached | $378,000 | 94.7% | 174 | Aug 26 |
| 3482 Dominion Rd | Detached | $680,000 | 97.2% | 19 | Aug 25 |
| 7 Butternut Cres | Condo Townhouse | $836,200 | 98.5% | 70 | Aug 19 |
| 3645 Allen Tr | Detached | $730,000 | 97.3% | 94 | Aug 17 |
| 3259 Jewell Ave | Detached | $640,000 | 98.5% | 19 | Aug 17 |
| 502 Carrie Ave | Detached | $895,000 | 96.8% | 94 | Aug 15 |
| 3721 Hibbard St | Detached | $320,000 | 91.4% | 31 | Aug 14 |
| 421 Prospect Point Rd N | Detached | $506,000 | 95.7% | 52 | Aug 13 |
| 121 Rochelle Cres | Detached | $599,000 | 99.8% | 18 | Aug 12 |
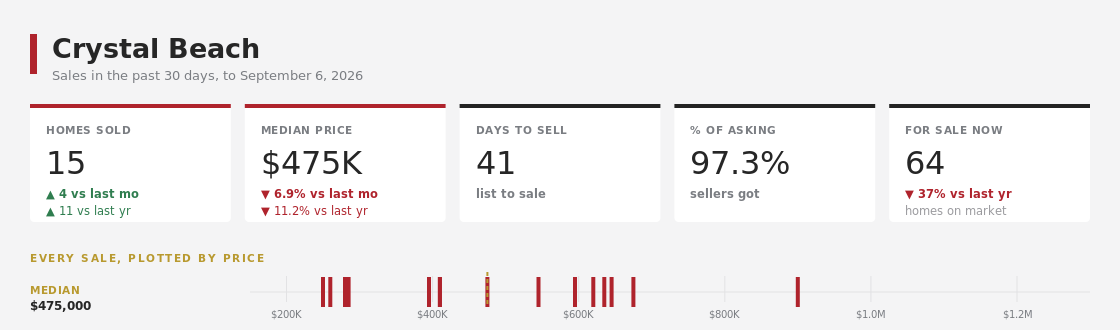
Crystal Beach sold 15 homes at a median of $475,000, up four from last month, though the median sits below both last month and a year ago as more modest-priced homes made up the mix. Three sales were new this week: 149 Cambridge Rd E at $545,000, 3786 Mathewson Ave at $260,000, and 303 Ridge Rd S at $250,000. Homes here still moved briskly, a median of 41 days, and sold at 97.3% of asking, among the strongest price discipline in town. Year to date Crystal Beach has sold 82 homes, well ahead of the 57 a year ago, at a median of $508,500, up about 8%. There are 64 homes for sale, down about 37% from a year ago, the sharpest pullback in supply of any area.
Crystal Beach home sales, 30 days to September 6, 2026
| Address | Type | Sale Price | SP/LP | DOM | Sold |
|---|---|---|---|---|---|
| 303 Ridge Rd S NEW | Detached | $250,000 | 92.6% | 41 | Sep 3 |
| 149 Cambridge Rd E NEW | Detached | $545,000 | 97.3% | 37 | Sep 2 |
| 3786 Mathewson Ave NEW | Detached | $260,000 | 93.9% | 43 | Aug 31 |
| 248 Lincoln Rd W | Detached | $410,000 | 95.6% | 88 | Aug 22 |
| 3852 Brunswick Ave | Detached | $280,000 | 93.3% | 29 | Aug 19 |
| 25 St George Crt | Detached | $595,000 | 93.0% | 49 | Aug 18 |
| 32 St George Crt | Detached | $645,000 | 100.8% | 21 | Aug 17 |
| 3819 Graeber Ave | Detached | $475,000 | 97.9% | 16 | Aug 16 |
| 3779 Crystal Beach Dr | Detached | $635,000 | 97.7% | 10 | Aug 14 |
| 4159 Smalls Rd | Detached | $620,000 | 95.4% | 20 | Aug 13 |
| 343 Cambridge Rd W | Detached | $410,000 | 97.9% | 79 | Aug 13 |
| 388 Ashwood Ave | Detached | $285,000 | 95.0% | 28 | Aug 12 |
| 18 Loganberry Crt | Detached | $899,990 | 100.0% | 45 | Aug 11 |
| 92 Schooley Rd | Detached | $674,900 | 100.0% | 46 | Aug 10 |
| 75 Cambridge Rd E | Detached | $395,000 | 98.8% | 60 | Aug 8 |
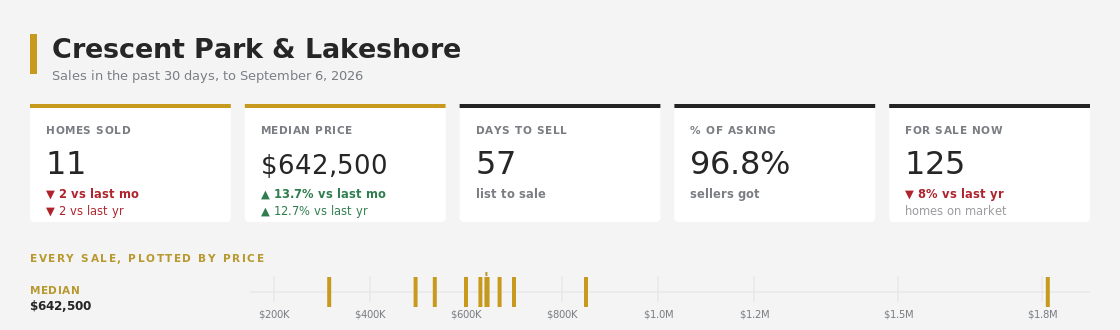
This combined area sold 11 homes at a median of $642,500, up about 13% from last month and up about 13% from a year ago. Four sales were new this week: 402 Washington Rd at $850,000, 527 Walden Blvd at $700,000, 787 Grandview Rd at $630,000, and 18 Parkview Ave at $642,500. The median time to sell was 57 days, and sellers here got about 96.8% of asking. Year to date the area has sold 93 homes, fewer than the 114 a year ago, at a median of $555,555, down about 5%. There are 125 homes for sale, down about 8% from a year ago, and still the most of any area.
Crescent Park & Lakeshore home sales, 30 days to September 6, 2026
| Address | Type | Sale Price | SP/LP | DOM | Sold |
|---|---|---|---|---|---|
| 527 Walden Blvd NEW | Detached | $700,000 | 93.5% | 50 | Sep 3 |
| 402 Washington Rd NEW | Detached | $850,000 | 99.0% | 83 | Sep 2 |
| 787 Grandview Rd NEW | Detached | $630,000 | 98.5% | 20 | Sep 2 |
| 18 Parkview Ave NEW | Detached | $642,500 | 98.9% | 36 | Sep 1 |
| 81 Ferguson Ave | Detached | $535,000 | 95.6% | 96 | Aug 29 |
| 1716 Rebecca St | Detached | $1,812,000 | 95.4% | 177 | Aug 28 |
| 881 Burwell St | Detached | $600,000 | 96.8% | 41 | Aug 16 |
| 710 Brian St | Detached | $670,000 | 95.7% | 127 | Aug 15 |
| 664 Lakeview Rd | Detached | $645,000 | 95.6% | 57 | Aug 14 |
| 344 Leask Ave | Detached | $495,000 | 99.0% | 8 | Aug 14 |
| 99 Joseph St | Detached | $315,000 | 100.0% | 72 | Aug 8 |
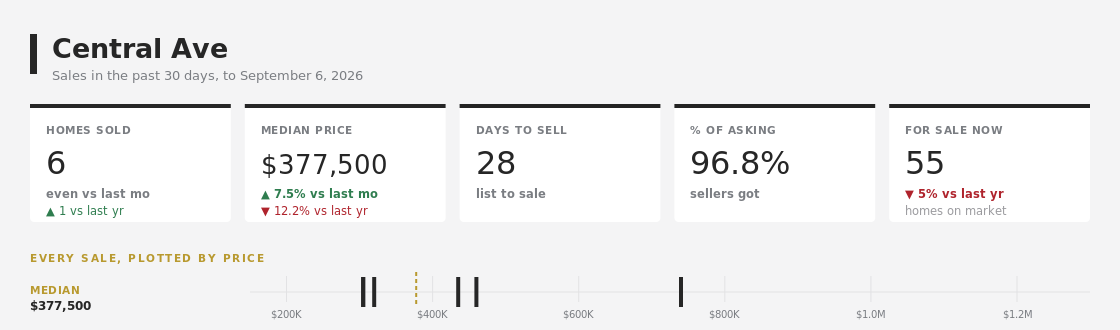
Central Ave, Fort Erie’s most affordable pocket, sold 6 homes at a median of $377,500, even with last month’s count and moving at a median of just 28 days, still the fastest pace in town. One sale was new this week: 351 Brock St at $305,000. Year to date Central has sold 49 homes, down from 57 a year ago, at a median of $410,000, off about 4%, so it remains the area where entry-level buyers have the best shot. There are 55 homes for sale, down about 5% from a year ago, the smallest pullback in supply of any area.
Central Ave home sales, 30 days to September 6, 2026
| Address | Type | Sale Price | SP/LP | DOM | Sold |
|---|---|---|---|---|---|
| 351 Brock St NEW | Detached | $305,000 | 93.8% | 33 | Aug 31 |
| 5 Aberdeen Crt | Detached | $320,000 | 98.5% | 23 | Aug 30 |
| 170 Aberdeen St | Detached | $460,000 | 96.8% | 15 | Aug 26 |
| 17 Lindbergh Dr | Detached | $740,000 | 98.7% | 23 | Aug 25 |
| 230 Hospital Dr | Semi-Detached | $305,000 | 90.0% | 99 | Aug 18 |
| 316 Bowen Rd | Detached | $435,000 | 96.7% | 45 | Aug 14 |
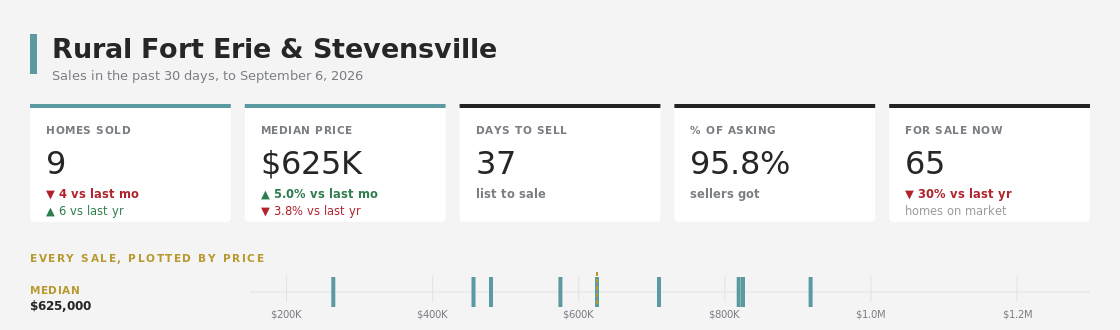
This combined rural area (Black Creek, Stevensville, Mulgrave, Point Abino, Bertie Ridge and Bowen) sold 9 homes at a median of $625,000. These are larger country and lakeside-edge properties, so a handful of deals moves the numbers a lot. Two sales were new this week: 3930 Village Creek Dr at $710,000 and 3747 Bowen Rd at $480,000. Homes here sold at about 95.8% of list and moved at a median of 37 days. Year to date the rural area has sold 62 homes, up from 45 a year ago, though the median of about $624,950 reads below 2025 because the mix leaned to smaller properties this year. There are 65 homes for sale, down about 30% from a year ago.
Rural Fort Erie & Stevensville home sales, 30 days to September 6, 2026
| Address | Type | Sale Price | SP/LP | DOM | Sold |
|---|---|---|---|---|---|
| 3930 Village Creek Dr NEW | Detached | $710,000 | 92.2% | 65 | Sep 4 |
| 3747 Bowen Rd NEW | Detached | $480,000 | 96.0% | 21 | Sep 1 |
| 3910 Christina Crt | Detached | $819,000 | 96.5% | 18 | Aug 29 |
| 3931 Main St W | Detached | $456,000 | 91.4% | 100 | Aug 28 |
| 3466 River Tr | Detached | $825,000 | 98.3% | 75 | Aug 25 |
| 2537 Stevensville Rd | Detached | $264,000 | 88.0% | 109 | Aug 22 |
| 2761 Arrowsmith Crt | Detached | $917,500 | 95.6% | 37 | Aug 19 |
| 3698 Sussex Lane | Detached | $575,000 | 95.8% | 28 | Aug 19 |
| 1363 Ott Rd | Detached | $625,000 | 100.0% | 13 | Aug 17 |
It is fairly balanced, tilting slightly toward buyers. There are 400 homes for sale and 58 sold over the past 30 days, so there is still meaningful choice, even though that pool of listings is down about 22% from a year ago. Well-priced homes are selling close to asking, at about 96.7% of list town-wide.
Crystal Beach is quicker right now, a median of 41 days to sell, versus 59 days in Ridgeway. Across the whole town the median is about six weeks.
Very closely. From January 1 to September 6, 390 homes have sold across the eleven neighbourhoods versus 381 a year ago, and the typical price of $550,000 is exactly the same both years. Prices have held steady while the pace of sales has picked up slightly.
Central Ave (Bridgeburg), where the typical home sold for $377,500 over the past 30 days and $410,000 year to date, and homes there are still moving the fastest in town. It remains the best entry point in Fort Erie, while Crescent Park & Lakeshore and the rural pocket run highest.
Fort Erie picked up pace this week. Fifty-eight homes sold over the past month, more than the prior month and well ahead of a year ago, while the typical price held close to $600,000. The for-sale count keeps shrinking though, now 400 homes across the eleven neighbourhoods, down about 22% from a year ago and lower than last week in every area, so the deep pool of choice buyers have enjoyed this summer is thinning out. The year-to-date numbers still say Fort Erie is tracking 2025 closely on both sales and price, just with a slightly busier late summer. If you are selling, homes that are priced to today’s market are still finding buyers close to asking within a month or two, and shrinking competition works in your favour. If you are buying, there is still real choice, but the stretch of peak selection looks to be behind us.
Want a personalized market analysis for your home? Book a call anytime, I’d love to help.
Mike Reles, Royal LePage. Data source: PropTx REALM (Niagara Association of REALTORS® MLS). Figures reflect residential freehold and condo transactions across Fort Erie’s eleven neighbourhoods, reported on a firm (pending) sale-date basis, so a sale is counted when the deal goes firm, which is earlier than the completion or possession date. Areas are grouped by REALM neighbourhood code: Ridgeway (335), Crystal Beach (337), Crescent Park & Lakeshore (334 and 333), Central Ave (332), and Rural Fort Erie & Stevensville (327 Black Creek, 328, 329, 330, 331 and 336). The current period is the 30 days ending September 6, 2026. Month-over-month compares the prior 30 days ending August 7, 2026, and year-over-year compares the same 30 days in 2025. Year-to-date figures cover January 1 to September 6 for each year. Days on market is measured from list date to firm date, not contract to close. Active for-sale and for-lease counts are a live snapshot taken today. The homes-on-market year-over-year figures (511 town-wide a year ago, versus 400 today) come from Habistat’s historical active-listing archive by neighbourhood, since MLS keeps no history of active-listing status.

I believe that real estate is personal. Not only is it the most meaningful investment in your life, but your home is also the place where you create memories with the people that you care about most. ....
The Big PictureOver the past 30 days, 58 homes sold across Fort Erie’s eleven neighbourhoods, up from 55 in the prior 30 days and well ahead of the 40 sold in the same stretch last year. The
The short version this month: sales cooled again, the typical price eased to $590,000, and there are still plenty of homes for sale. Over the 30 days ending August 27, 497 homes sold across the
The Big PictureOver the past 30 days, 55 homes sold across Fort Erie. The typical home sold for about $600,000, took about a month to sell (a median of 31 days), and went for roughly 97.3% of.
Sales have eased again, the typical price is holding just below $600,000, and there are still plenty of homes for sale. Over the 30 days ending August 20, 512 homes changed hands across the Niagara